![]()
Please refer to the Settings Guide for details.
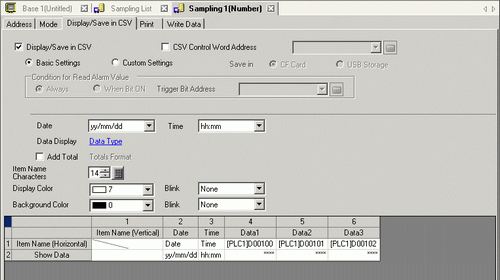
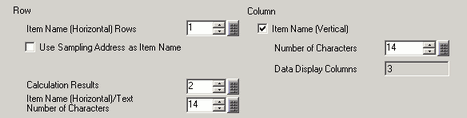
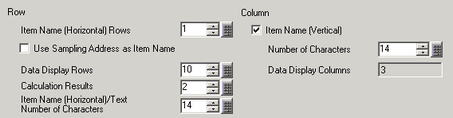
 24.8.4.7 Display/Save in CSV (Custom Settings)
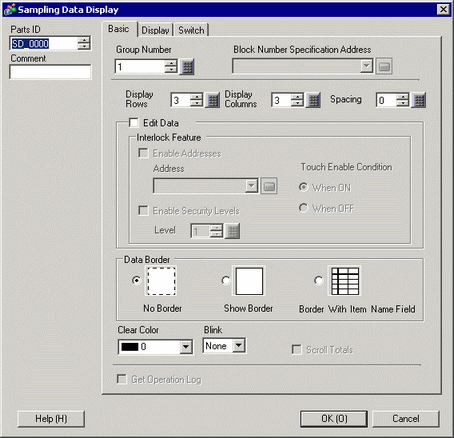
24.9 Sampling Data Display GuideFor details on how to draw parts, and defining the address, shape, color, and labels, please see the parts editing topic.
8.6.1 Editing Parts