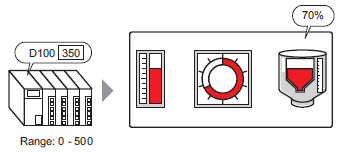
Displaying the Current Value in a Bar/Circle/Tank Graph Overview Steps |
---|
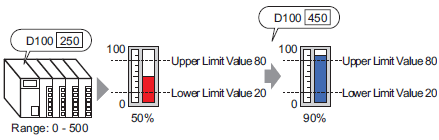
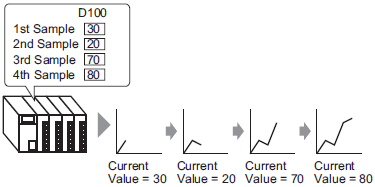
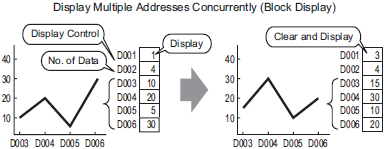
Specified data stored in a device/PLC can be displayed as a Graph. |
Displaying an Alarm in a Bar/Circle/Tank Graph Overview Steps |
---|
The displayed color will change when the value exceeds a set range. |
Using Trend Graphs Overview |
---|
Displays changes in data on a trend graph. |
Show/Hide Data Lines in Graphs Overview |
---|
You can show/hide the graph for each channel. |
Display a Base Line in a Graph |
---|
You can set three auxiliary lines: Upper Limit, Lower Limit, and Standard. |
Zoom Graph Scale In or Out Overview |
---|
The trend graph can be zoomed out in a longer range for normal use, or zoomed in within shorter range if you want to view it in detail. |
Place Normalized Data on a Graph for Comparison with Actual Data Overview Steps |
---|
Values of two Word devices are collected and points and lines are displayed in a graph as x-axis/y-axis coordinates. Normalized data and x-axis/y-axis data can also be displayed. |
Using a Trend Graph to View Historical Data Overview Steps |
---|
You can display a trend graph's past data. |
Displaying Multiple Addresses Concurrently (Block Display) Overview Steps |
---|
Display the values of multiple consecutive Word Addresses on a single trend graph. |
Compare Historical and Current Data Values in a Graph Overview Steps |
---|
Multiple data consisting of a pair of two Word devices' values are collected at once and points and lines are displayed in a graph. |