![]()
Please refer to the Settings Guide for details.
 18.13 Historical Trend Graph Settings Guide
For details about placing parts or setting addresses, shapes, or colors, please see the following.
8.6.1 Editing Parts
![]()
Please refer to the Settings Guide for details.![]() 18.13 Historical Trend Graph Settings Guide
18.13 Historical Trend Graph Settings Guide
For details about placing parts or setting addresses, shapes, or colors, please see the following.![]() 8.6.1 Editing Parts
8.6.1 Editing Parts
Set three auxiliary lines: Upper Limit, Lower Limit, and Standard.
From the [Parts (P)] menu, select [Historical Trend Graph (H)] or click ![]() . Place the Graph on the screen.
. Place the Graph on the screen.
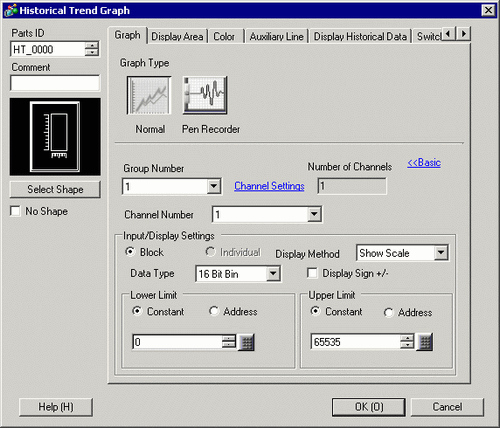
Double-click the new Graph. The following dialog box appears.
Set the sampling group and address, then adjust settings such as line color, number of display data, and so on.![]() 18.4.1 Procedure - Using Trend Graphs
18.4.1 Procedure - Using Trend Graphs
In the [Graph] tab, click [Extended] and select [Show Scale] for [Display Method] in the [Input/Display Settings].
The [Auxiliary Line] tab appears. Click the [Auxiliary Line] tab.
The auxiliary line setting is selected for [Upper Limit]. Set the upper limit auxiliary line.
Select [Draw Line] and set the display position, type, display color, and other properties for the line.
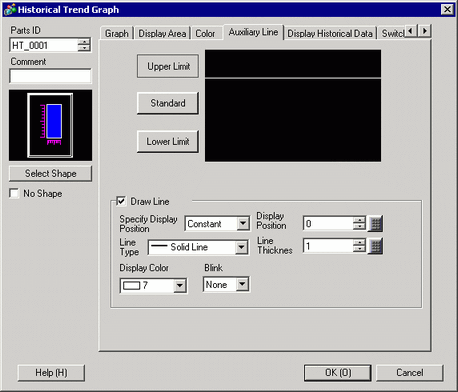
Click [Lower Limit] and [Standard], set the details for each auxiliary line in a similar manner, and then click [OK].