|
Before
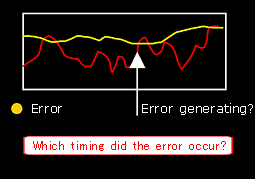
You wish to refer to the process of the data when an error occurred.
But the usual graph might not show when the error occurred.
|
 |
This can be done.!
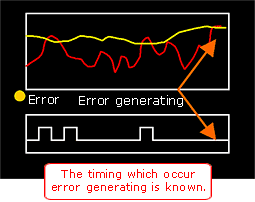
The data till the error occurred can be displayed in a graph. Since the bit data can be also graphed, it can be compared with the sensor state.
|
 |
 |
|
|
Characteristics |
| ・ |
Data for 60 seconds (one second sampling) before an error occurs can be displayed in a graph. |
| ・ |
When no error occurs, data for 60 seconds before is discarded, which is a Ring Buffer Form. |
| ・ |
Since data can be memorized in a touch panel (SRAM) even when power supply turns OFF, the data can be displayed again. |
|
|
* A color liquid crystal type of GP2000 series, GLC2000 series support this functionality.
* Software in addition to GP-PRO/PB III for Windows Ver. 6.1 or more is required.
|
Download a sample program file and a detailed description.
|
 |

