Products
Download
Contact us
Back to Top

 FAQ

 What’s the Alarm Analysis function?


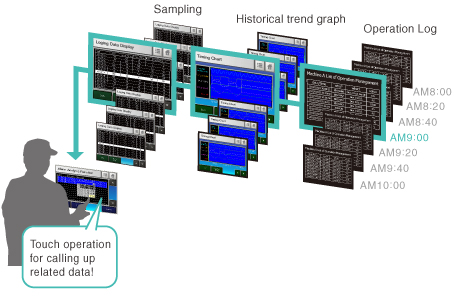
With this function, you can call up and display sampling data, trend graphs, and operation log when an error occurs based on the time of Trigger/Acknowledge/Recover in Alarm History on the Alarm Message Display screen.

You can examine what kinds of operations were performed and what changed in data before and after the alarm. This is useful for analyzing the cause of the alarm.


IMPORTANT
- The Alarm Analysis function is supported by GP4000 series except GP-4*01TW/4*01WW.
For details of the supported models, see [Supported Features] in Chapter 1 of GP-Pro EX Reference Manual.
- To use the Alarm Analysis function, it’s necessary to select [History] for [Display Mode] in the Alarm Parts setting. If [Log] or [Active] is selected, the function will not operate.

NOTE

Reference:

How can I configure the Alarm Analysis setting?
  GP-Pro EX Reference Manual [Alarm Analysis for Operation Log and Sampling]
 

Operation Example of Alarm Analysis Screen
<Example> Analyze the [Abnormal Temp.] alarm, which occurred at 10:10:00 on Oct 17 in 2011
  (The temperature data are collected in Sampling Group [3])
 
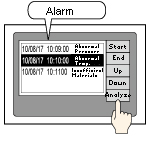
(1)
Select "2011/10/17 10:10:00"
[Abnormal Temp.]” and touch the [Analyze] button.
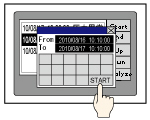
  (2)
Specify the time range of the related data you want to check.
"From 2011/10/16 10:10:00 to 2011/10/17 10:10:00
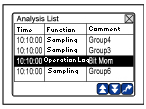
  (3)
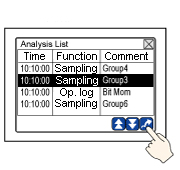
A list of the sampled data and operation log at the time specified in the step (2) appears.
- To see the trend graph (Historical Trend Graph)
- To see the sampled numerical data (Sampling Data Display)
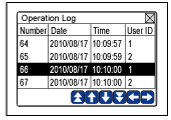
- To see Operation Log
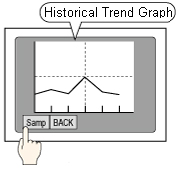
To see the trend graph (Historical Trend Graph):
 

(4)
Select the data at [2011/10/17 10:10:00] and touch the button.
  (5)
The trend graph appears with the cursor indicating the time, [2011/10/17 10:10:00].
 
 
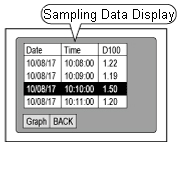
To see the sampled data (numerical values) (Sampling Data Display):
 

(4)
Select the data at [2011/10/17 10:10:00] and touch the button.
  (5)
The data collected at   [2011/10/17 10:10:00] appear in inverted display on the Sampling Data Display.
 
 
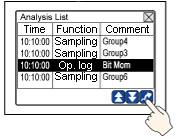
To see Operation Log:
 

(4)
Select the operation log at [2011/10/17 10:10:00] and touch the button.
  (5)
The operation log collected at  [2011/10/17 10:10:00] appears in inverted display.
 
 
Back to page top Return to the previous page
FAQ for use | Protection of Personal Information | Trademark Acknowledgments | About Intellectual Property Rights | Terms of Use
Copyright (C) 2005- Schneider Electric Japan Holdings Ltd. All Rights Reserved.