| 1. |
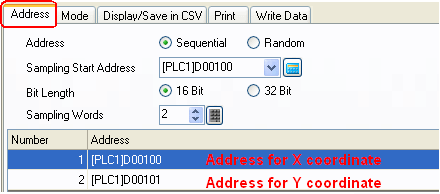
In the [Sampling] setting window, set word addresses to be displayed in X coordinate and Y coordinate. |
|
|
|
e.g.) Address for X Coordinate = D100, Address for Y Coordinate = D101 |
|
 |
|
|
|
|
| 2. |
Open the [XY Historical Scatter Graph] settings window. |
|
|
| 3. |
On the [Graph] tab, click [Channel Settings].
|
|
 |
|
|
| 4. |
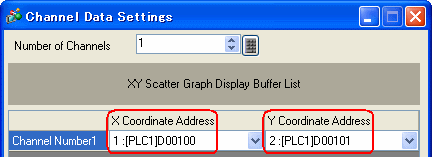
The [Channel Data Settings] window will open. Set the [Number of Channels], [X Coordinate Address], and [Y Coordinate Address]. |
|
 |
|
|
| 5. |
Click [Extended]. |
|
 |
|
|
| 6. |
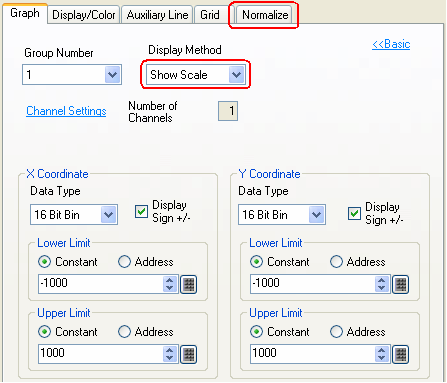
If you specify [Show Scale], the [Normalize] tab will appear.
|
|
 |
|
| NOTE |
| You can make settings of [Normalize] only when [Show Scale] is specified. |
|
|
|
| 7. |
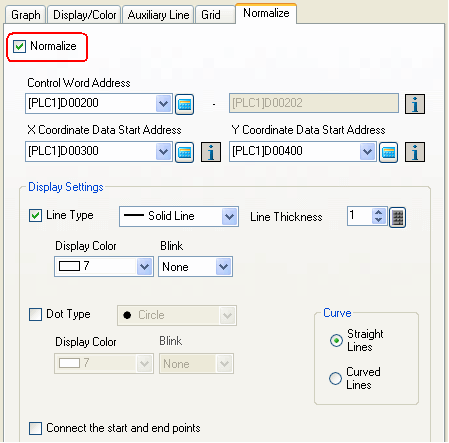
Check the [Normalize] box on and set the [Control Word Address], [X Coordinate Data Start Address], [Y Coordinate Data Start Address], etc. |
|
|
|
 |
|
|
|
|
|
| NOTE |
|
To use this feature, your screen editor must be GP-Pro EX Ver. 2.20 or above.
|
|

