![]()
-
Please refer to the Settings Guide for details.
 19.13 Historical Trend Graph Settings Guide
 -
For details about placing parts or setting addresses, shapes, or colors, please refer to the "Part Editing Procedure".
8.7.1 Editing Parts
![]()
Please refer to the Settings Guide for details.
![]() 19.13 Historical Trend Graph Settings Guide
19.13 Historical Trend Graph Settings Guide
For details about placing parts or setting addresses, shapes, or colors, please refer to the "Part Editing Procedure".
![]() 8.7.1 Editing Parts
8.7.1 Editing Parts
Show/hide the Channel No.2 graph by touching the switch.
From the [Parts (P)] menu, select [Historical Trend Graph (H)] or click ![]() . Place the Graph on the screen.
. Place the Graph on the screen.
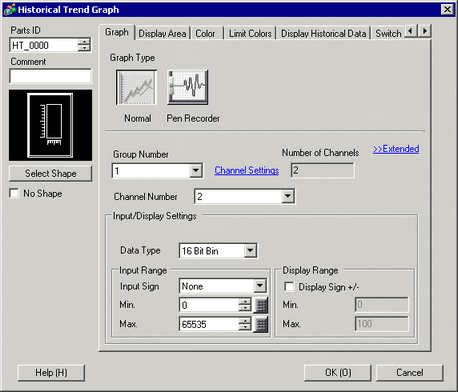
Double-click the new Graph. The settings dialog box appears.
Set the sampling group and address, then adjust settings such as line color, number of display data, and so on.
In [Number of Channels] from [Channel Settings], set the number of sets of data lines to display on the graph (2). Apply the same settings on the graph to be displayed using [Channel No.2].
![]() 19.4.1 Procedure - Using Trend Graphs
19.4.1 Procedure - Using Trend Graphs
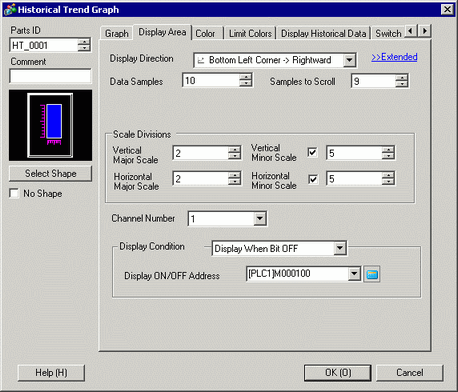
Configure the Channel No. for the graph you want to show/hide. Click the [Display Area] tab and select "2" from [Channel No].
![]()
Changing [Channel No] will change the setting items on the other tabs for the selected [Channel No].
From [Display Condition], choose [Display When Bit OFF].
In [Display ON/OFF Address], select the address (for example, M100) for changing the show/hide status of the graph, and click [OK].
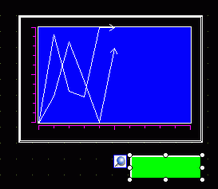
Place a switch to change the show/hide status of the Channel No. 2 graph.
On the [Parts (P)] menu, point to [Switch Lamp], and select [Bit Switch (B)], or click ![]() to place a switch on the screen.
to place a switch on the screen.
Double-click the switch. The following dialog box appears.
In the [Bit Address] list, select the (M100) address for changing the show/hide status of the graph and select [Bit Invert] in the [Bit Action] list.
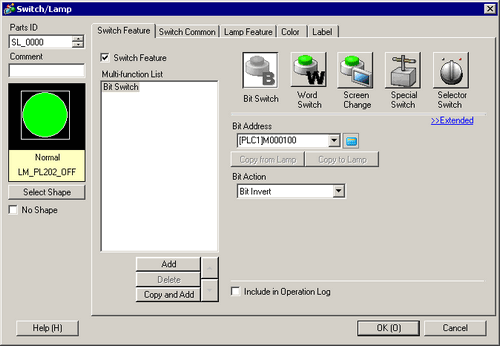
As needed, set the color and display text on the [Color] tab and [Label] tab, and click [OK].
![]()
Depending on the shape, you may not be able to change the color.
When you select a switch and press the [F2] key, you can directly edit the text on the label. When [Text Table] is selected, you can change the current Text Table.