![]()
-
Please refer to the Settings Guide for details.
 19.13 Historical Trend Graph Settings Guide
 -
For details on how to draw parts and define the address, shape, color, and labels, please see the "Part Editing Procedure".
8.7.1 Editing Parts
![]()
Please refer to the Settings Guide for details.
![]() 19.13 Historical Trend Graph Settings Guide
19.13 Historical Trend Graph Settings Guide
For details on how to draw parts and define the address, shape, color, and labels, please see the "Part Editing Procedure".
![]() 8.7.1 Editing Parts
8.7.1 Editing Parts
Use these settings when you want to check a Word Address (D100) historic data.
From the [Parts (P)] menu, select [Historical Trend Graph (H)] ![]() . Place the Graph on the screen.
. Place the Graph on the screen.
Double-click the new Graph. The following dialog box opens.
Set the sampling group and address (D100), then select the display settings such as the line color, number of display data, etc.
![]() 19.4.1 Procedure - Using Trend Graphs
19.4.1 Procedure - Using Trend Graphs
Click the [Display Historical Data] tab and select the [Display Historical Data] and [Show Cursor] check box.
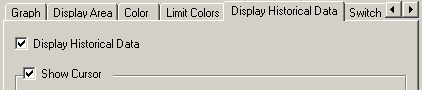
![]()
Only one Historical Trend Graph part with a Display Historical Data function can be placed per screen.
For sampling groups without [Back Up Sampling Data] selected in the [Mode] tab in the common settings [Sampling], [Show Cursor] does not work when selected.
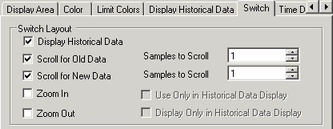
Set the switches to display historical data.
Select the [Switch] tab to set the number of rows to scroll up or down per touch.
![]()
When you use the [Switch Lamp] part's [Special Switch] function to add [Historical Trend Graph Switch] actions (instead of using switches in the Historical Trend Graph part), you can define the shape and color of individual switches.
For sampling groups without [Back Up Sampling Data] selected in the [Mode] tab in the common settings [Sampling], [Zoom Display] and [Zoom Out Display] switches do not work when they are selected.
In [Select Shape], select the Switch shape.
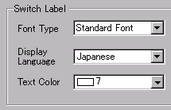
In [Switch Label], select the Switch Label [Font Type] and [Display Language]. Set the [Text Color].
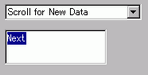
In [Switch Label], choose a switch and enter text in [Label]. Type a label for each switch.
In [Switch Color], select the color of the switch.
![]()
The switches are placed on the top right of the Historical Trend Graph.
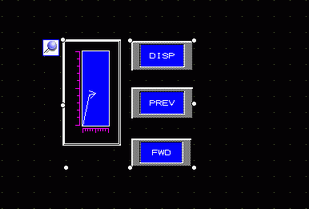
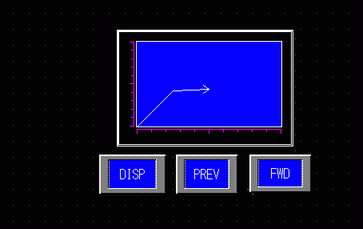
Each switch on the graph can be individually selected and moved anywhere within the screen.
Depending on the shape, you may not be able to change the color.
When you select only a switch and press the [F2] key, you can directly edit the text on the label.
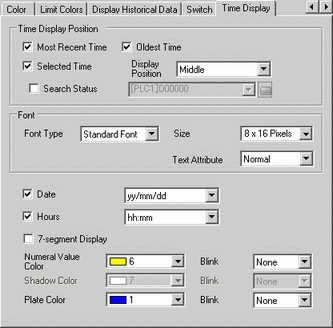
In the [Time Display] tab, select the [Most Recent Time] or [Oldest Time] check box. Set the display format and color, and click [OK].
![]()
For sampling groups without [Add Time Data] selected in the [Mode] tab in the common settings [Sampling], [Most Recent Time], [Oldest Time] or [Selected Time] does not work when they are selected.
To display [Selected Time], select [Back Up Sampling Data] in the [Mode] tab in the common settings [Sampling] and [Show Cursor] in the [Display Historical Data] tab in Historical Trend Graph.