![]()
-
Please refer to the Settings Guide for details.
 19.14 Data Block Display Graph Settings Guide
 -
For details on how to draw parts, and define the address, shape, and color, please see the "Part Editing Procedure".
8.7.1 Editing Parts
![]()
Please refer to the Settings Guide for details.
![]() 19.14 Data Block Display Graph Settings Guide
19.14 Data Block Display Graph Settings Guide
For details on how to draw parts, and define the address, shape, and color, please see the "Part Editing Procedure".
![]() 8.7.1 Editing Parts
8.7.1 Editing Parts
When bit 0 of a word address (D100) is turned on, and a Graph is created, displaying the trend graph of data from 4 consecutive words in block display.
From the [Parts (P)] menu, select [Data Block Display Graph (L)] or click ![]() . Place the Graph on the screen.
. Place the Graph on the screen.
Double-click the placed Data Block Display Graph. The following dialog box appears.
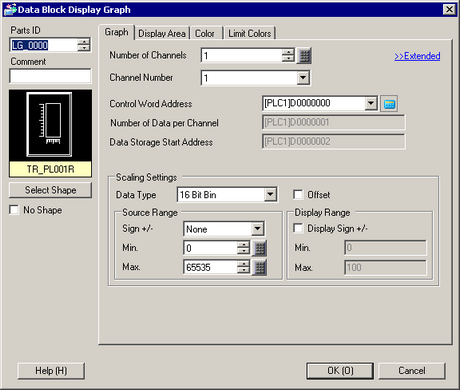
In [Select Shape], select the Graph shape.
In [Control Word Address], set the address (D100) to control the graph display.
The address (D101) used to store the number of sets of data displayed on the graph "4" displays in [Number of Channels Address].
In the [Min] and [Max] fields, set the range of data stored in that address. If you are storing negative values, set [Sign +/-] to [2's Complement] or [MSB Sign].
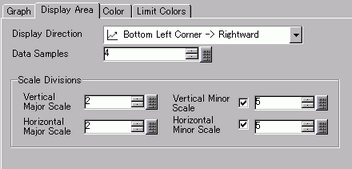
On the [Display Area] tab, set [Display Direction]. Set the [Data Samples] to 4.
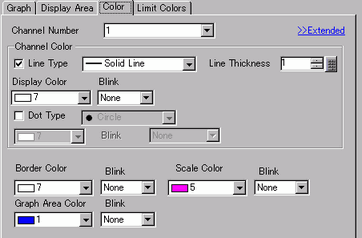
On the [Color] tab, set the color and type of the line to be displayed, and the color of the Graph Display Area. Next click [OK].