![]()
-
Please refer to the Settings Guide for details.
 19.12 Graph Part Settings Guide
 -
For details about placing parts or setting addresses, shapes, or colors, please refer to the "Part Editing Procedure".
8.7.1 Editing Parts
![]()
Please refer to the Settings Guide for details.
![]() 19.12 Graph Part Settings Guide
19.12 Graph Part Settings Guide
For details about placing parts or setting addresses, shapes, or colors, please refer to the "Part Editing Procedure".
![]() 8.7.1 Editing Parts
8.7.1 Editing Parts
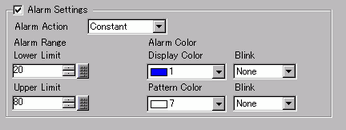
Set the Graph color such that it changes when the word address (D100) data falls below 20% or above 80% of the Acquisition Range.
From the [Parts (P)] menu, select [Graph (G)] or click ![]() . Place the Graph on the screen.
. Place the Graph on the screen.
Double-click the new Graph. The following dialog box appears.
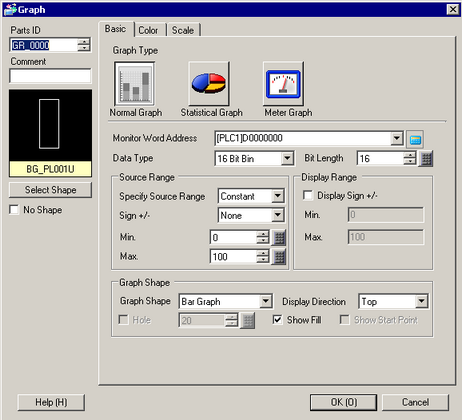
In [Monitor Word Address], set the address (D100) you want to display. Then set the [Data Type] and [Bit Length].
In the [Specify Source Range] drop-down list, select [Constant], and specify the range of data that is stored in that address (for example, minimum value 0, maximum value 500).
In the [Graph Shape] drop-down list, select [Bar Graph].
![]()
You can also select [Circle Graph], [Semicircle Graph], and [Tank Graph].
In [Select Shape], select the Graph shape.
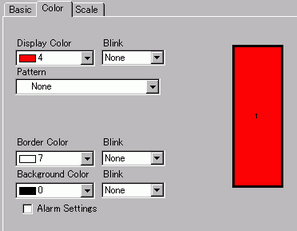
On the [Color] tab, set the [Display Color].
Set the Graph's other colors (pattern color, border color) if necessary.
Select the [Alarm] check box, and specify the alarm range as a percentage. (For example, Lower Limit 20, Upper Limit 80). In [Display Color], set the color for the alarm.
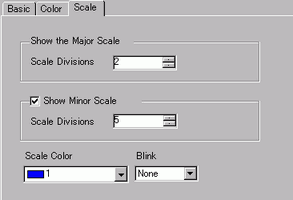
On the [Scale] tab, set to show the scales and the color and blink. Click [OK].
![]()
For graph parts with a scale, Scale Label for the major scale can be automatically placed using a text part.
Right-click the graph part with a scale and click [Scale Label Placement]. The [Text] dialog box appears. Set up each item and click [OK].