![]()
For Historical Trend Graphs, Data Block Display Graphs, XY Historical Scatter Graphs and XY Block Display Scatter Graphs, you can display up to 8 graphs on a single screen (including called screens and popup windows) at the same time.
For Historical Trend Graphs, Data Block Display Graphs, XY Historical Scatter Graphs and XY Block Display Scatter Graphs, you can display up to 40 channels on a single screen (including called screens and popup windows) at the same time. Any subsequent channels do not display.
The maximum number of channels (number of lines) that can be displayed on a single Historical Trend Graph is 20.
To draw lines within the display area on the historical trends graph, place the graph on a base screen numbered 9000-9999. If you draw scale lines within the graph display area on a base screen numbered 1-8999, the scale lines will not be displayed on the display unit. To display a graph with scale lines on a base screen numbered 1-8999, call up a screen with a number above 9000.
When the sampling period is specified as 1 second or less, depending on the size of the graph display area used, scroll processing can take almost one second, and communication and tag processing can be affected.
In this case, setting the sampling period to two or more seconds should correct the problem.
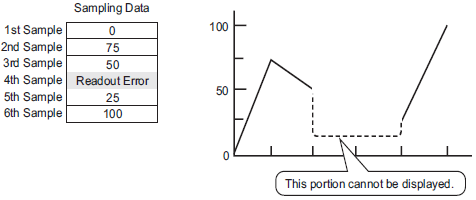
If an error occurs when reading the data samples, the line on that portion of the graph is not displayed. If the error continues, that period does not appear on the graph.
When the next sampled data displays on the historical trend graph, it displays as follows.
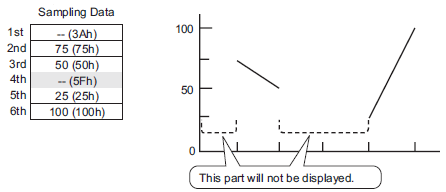
If the [Data Type] of the historical trend graph part is set to [BCD] and the sampled data that includes A to Fh is stored, the graph will not be displayed.
When the next sampled data displays on the historical trend graph, it displays as follows.
If the [Data Type] of the historical trend graph part is set to [BCD] and the sampled data that includes A to Fh except BCD (except 0 to 9) is stored, the graph containing the previous sampled data will be displayed.
When the next sampled data displays on the historical trend graph, it displays as follows.
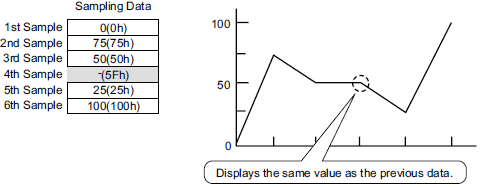
The fourth sample, 95(5Fh) is ignored, and the third sample, 50(32h), is shown in its place on the Graph.
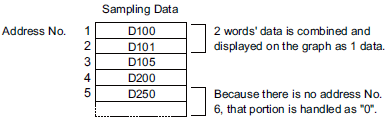
Set the [Data Type] on the Historical Trend Graph to match the data sample bit length. If the [Bit Length] is set to [16 Bit] and the [Data Type] is 32 bit, two Words' data are combined and handled as 32 bit.
If there are multiple Historical Trend Graphs with the same Parts ID on the same screen, the graph that was placed will be considered valid. The second graph will not be displayed. The same is true for when loading the screen using Call Screen--the graph that is placed first will be displayed while the second graph will not be displayed.
Even when Show Cursor is set in Historical Trend Graph, the cursor is not displayed for the sampling group for which [Use Memory Card as Backup Area] is not checked in Sampling Settings.
When the number of sampling is 1, Thin Out Mode is disabled.
When using the graph area color on a historical trend graph with the [No Shape setting] placed on a base screen number 9000 or higher, drawing is done in the following order.
Graph Area Color in Historical Trend Graph
Drawings such as Line or Rectangle, or Base screen background color
Data line of Historical Trend Graph
Thus, if a drawing is placed on the display area of the Histrical Trend Graph or the plate color of the base screen is set, these are drawn before drawing the Graph Area Color.
Restrictions on Displaying Historical Data
Only one Historical Trend Graph part with a Display Historical Data function enabled can be placed on a Base screen.
You cannot use Display Historical Data Settings on a window screen when using GP-Pro Ex V2.20 or earlier. The Display Historical Data function does not work.
For the sampling group without Display Historical Data selected, Historical Display mode will not turn on, even if Display Historical Data is set in Historical Trend Graph.
When you erase data samples stored in the display unit, Historical Data cannot be displayed.
The Number of Data (current data + historical data) that can be displayed in one channel with Display Historical Data is the amount in [Cycles] specified in the sampling settings.
For the Historical Trend Graph [Data Samples], set a number less than [Cycles] in the sampling settings.
The number of sets of sampled data that can be saved on the display unit depends on the capacity of the backup SRAM *1 and the intended use, as well as the sampling settings.![]() 24.11.1 About Backup SRAM
24.11.1 About Backup SRAM
The table below shows the maximum number of samples when the backup SRAM is used only for backing up the sampling groups used in a trend graph.
The maximum number of samples per Number of Channels
|
Backup SRAM Size |
1 Channels |
10 Channels |
20 Channels |
30 Channels |
40 Channels |
|
320KB |
65535 |
16265 |
8132 |
5421 |
4065 |
|
128KB |
32180 |
6435 |
3217 |
2144 |
1608 |
Description
Number of Sampling Groups = 1, Blocks = 1, Data Type = 16 Bit, Overwrite old data after finishing the specified number of times, No Date Data, No Data Enabled/Disabled flags
Do not use two different types of switches for the same Historical Trend Graph. The switch will not operate normally. For each Historical Trend Graph, set up no more than one [Historical Data Display] switch.
When using a Switch Lamp [Special Switch] - [Historical Trend Graph Switch] for Display Historical Data, place the Special Switch and the trend graph with the Display Historical Data function on the same Base screen. If the Historical Trend Graph is placed on the Base Screen and the Special Switch on the Window Screen, they will not function.
While in Display Historical Data mode, new samples will not be displayed even if they occur. The display will update when Display Historical Data mode is released. Even while in Display Historical Data mode, data sampling continues.
Changing screen while in Display Historical Data mode cancels the mode.
Restrictions on Using Memory Cards as a Backup Area
In the Common Settings workspace, select a Sampling node and select the Mode tab. When its [Use Memory Card as Backup Area] check box is selected, the following restrictions apply to Historical Trend Graphs.
Only one Historical Trend Graph set for the sampling group with the [Use Memory Card as Backup Area] check box selected can be placed per base screen. When multiples are placed, the search function, Show Cursor, and Zoom In/Zoom Out will not work.
Select the [Show Cursor] check box if [Use Memory Card As Backup Area] is selected. If [Show Cursor] is not selected, data saved in the memory card will not display the cursor.
When [Add Time Data] in sampling settings is not set, sampling data from date and time on the display unit screen cannot be searched and displayed. In addition, Show Cursor, and Zoom In/Zoom Out are disabled. For historical data dislay shows backup SRAM data only.
If there are only two display points on the graph as a result of Zoom Display, further Zoom In will not work.
The Display Historical Data function cannot be used in Window Screens, so the search function, Show Cursor, and Zoom In/Zoom out will not work.
The [Selected Time] display cannot be set at the same time as an editable Sampling Data Display and Special Data Display's [CSV Display]. When they are in the same screen, only the part that was set first (Selected Time Display or Sampling Data Display) will work.
When the time on the display unit changes to create a file earlier than the saved data, the file will not display in the graph.
To display the sampled data on a different display unit, the sampling group settings in both display units must be the same.
*1 The capacity differs depending on the model. To check the capacity, go to the [Project (F)] menu, point to [Information (I)], select [Project Information (I)], and then select [SRAM Information].