25.8.1 Procedure - Display/Save Sampled Data in CSV with a Custom Format

Configure settings so that the display format for Sampling Group 1 is as follows.

  1. In the [Common Settings (R)] menu, select [Sampling (D)] or click , and a list of registered sampling groups appear. Double-click the row for [Group] 1 and the sampling group 1 setup screen appears.

    (For information about Address/Action settings, please refer to 25.3.1 Procedure - Sampling Data at Constant Intervals.)

  2. Open the [Display/Save in CSV] tab.
    Select the [Display/Save in CSV] check box, and select [Custom Settings].

  3. Set [Item Name (Horizontal) Rows] to 1, and [Calculation Result] to 2.

    • When the [Overwrite old data after finishing the specified cycles] check box is cleared, set the [Data Display Rows]. Adjust the number of data display rows to match the number of sample occurrences.

  4. Select the Date column in the Preview area and click [Detail Settings]. The [Date Set] dialog box appears. Change the date form to [mm/dd].

    Click [OK] to close the dialog box.

  5. Delete the address D101 data column from the display format. Select the fifth column (Data 2) and click the [Delete] key.

    • To delete, you can right-click the fifth column (Data 2) to display a popup menu, then click [Delete].

  6. Double-click each Item Name (Horizontal) cell and input the Item Name.

    You can input text in the language designated in the Sampling List [Language].

  7. Move the column. Select the fourth column (Data 1) and click [Move Right].

  8. Select the third row and click [Row Details]. The [Calculation Settings] dialog box appears. Change the [Calculated Data] to [Max].

    As needed, set the calculation row's [Data Type] or [Total Display Digits] and click [OK].

    • If you select a data column's calculation cell and click [Row Details], you can set [Data Type], or [Total Display Digits] independently.

  9. Select the calculation data in the fourth row and set [Min] in the same way.

  10. Double-click the calculation cells in the Item Name (Vertical) column and input the Item Name for each row.
    The customized Display/Save in CSV format is now set.

    • The format of CSV files saved in an external storage differs slightly from the state displayed on the setting screen. Refer to the following section.
      25.14.5.1 CSV File Format

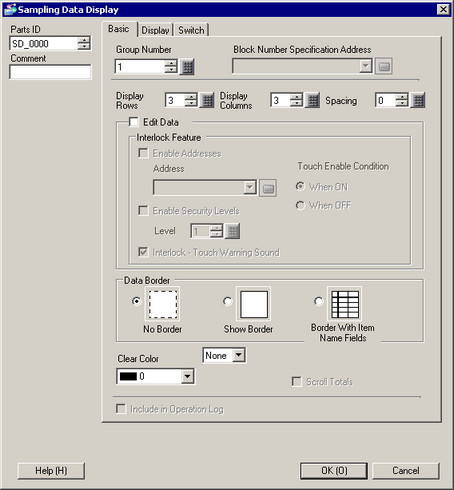
  11. Open the editing screen, and on the [Parts (P)] menu select [Sampling Data Display (S)], or click , to place the Part on the screen.

  12. Double-click this part to open the [Sampling Data Display] dialog box.

  13. Define the sampling group you want to display on the screen. Set Sampling Group No. to "1".

    • To display the sampling group, use the [Block Number Specification Address] to define which block to display. This field is enabled if in the [Common Settings (R)] workspace, [Sampling] screen, [Mode] tab, [Extended] area, the [Overwrite old data after finishing the specified cycles] check box is cleared.

  14. Set the [Display Rows] and [Display Columns].

    • Select [Edit Data], if you wish to edit the sampling data on the screen. This requires you to set up a keypad for editing the data. The screen will change to the editing screen by touching the data, and the data can be edited using the keypad.

  15. Select whether to show the Ruled Line/Border and whether to use the [Clear Color].

  16. As needed, set the font size and scroll switch layout on the [Display] and [Switch] tabs and click [OK].