![]()
-
Please refer to the Settings Guide for details.
 19.13 Historical Trend Graph Settings Guide
 -
For details about placing parts or setting addresses, shapes, or colors, please see the following.
8.7.1 Editing Parts
![]()
Please refer to the Settings Guide for details.
![]() 19.13 Historical Trend Graph Settings Guide
19.13 Historical Trend Graph Settings Guide
For details about placing parts or setting addresses, shapes, or colors, please see the following.
![]() 8.7.1 Editing Parts
8.7.1 Editing Parts
Set three auxiliary lines: Upper Limit, Lower Limit, and Standard.
From the [Parts (P)] menu, select [Historical Trend Graph (H)] or click ![]() . Place the Graph on the screen.
. Place the Graph on the screen.
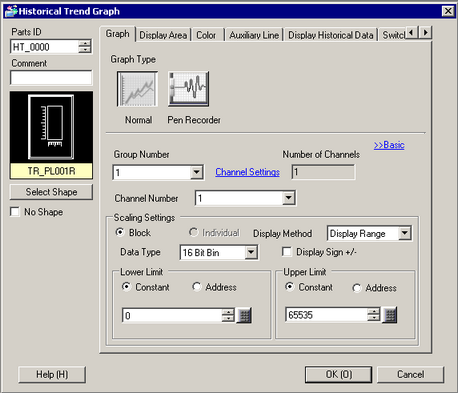
Double-click the new Graph. The following dialog box appears.
Set the sampling group and address, then adjust settings such as line color, number of display data, and so on.
![]() 19.4.1 Procedure - Using Trend Graphs
19.4.1 Procedure - Using Trend Graphs
In the [Graph] tab, click [Extended] from [Scaling Settings] and set [Display Method] to [Display Range].
The [Auxiliary Line] tab appears. Click the [Auxiliary Line] tab.
The auxiliary line setting is selected for [Upper Limit]. Set the upper limit auxiliary line.
Select [Draw Line] and set the display position, type, display color, and other properties for the line.
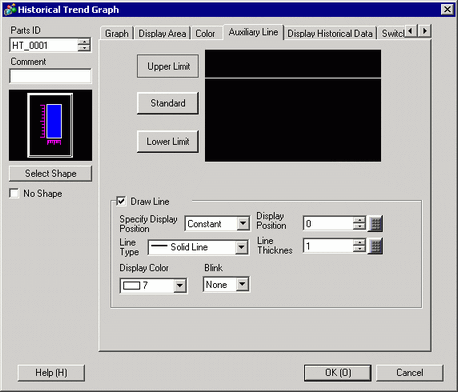
Click [Lower Limit] and [Standard], set the details for each auxiliary line in a similar manner, and then click [OK].