![]()
-
Please refer to the Settings Guide for details.
 19.13 Historical Trend Graph Settings Guide
 -
For details about placing parts or setting addresses, shapes, or colors, please refer to the "Part Editing Procedure".
8.7.1 Editing Parts
![]()
Please refer to the Settings Guide for details.
![]() 19.13 Historical Trend Graph Settings Guide
19.13 Historical Trend Graph Settings Guide
For details about placing parts or setting addresses, shapes, or colors, please refer to the "Part Editing Procedure".
![]() 8.7.1 Editing Parts
8.7.1 Editing Parts
Each time a Word Address (D100) data point is sampled, that data point displays on a trend graph.
From the [Parts (P)] menu, select [Historical Trend Graph (H)] or click ![]() . Place the Graph on the screen.
. Place the Graph on the screen.
Double-click the new Graph. The following dialog box appears.
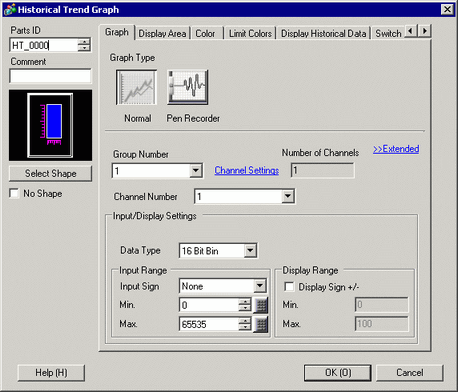
In [Select Shape], select the Graph shape.
In [Group Number], select the number of the sampling group you want to display.
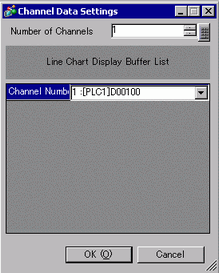
Click [Channel Settings]. The following dialog box appears.
In [Number of Channels], set the number of sets of data lines to display on the graph (1). In [Channel Number 1], select the graph display address (for example, D100).
Set the data type and input range (Min/Max) for the graph data.
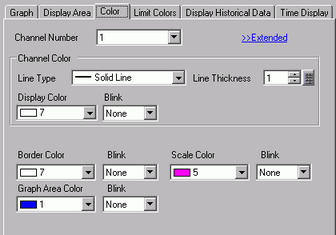
On the [Color] tab, set the color and type of the line to be displayed and the color of the Graph Display Area.
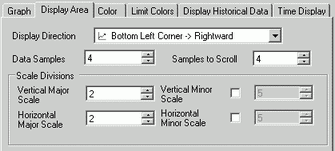
In the [Display Area] tab, set the graph Display Direction and the number of Data Samples as "4". Set the same value for the Samples to Scroll as the Data Samples. If required, set up a scale.
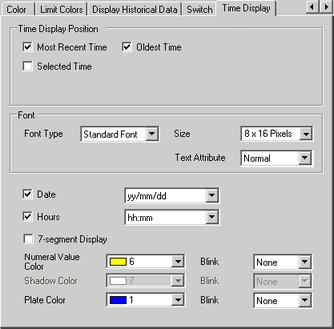
In the [Time Display] tab, select the [Most Recent Time] and [Oldest Time] check boxes, and set the format for the displayed date and time.
![]()
[Oldest Time] is placed in the lower left axis of the Historical Trend Graph, and [Most Recent Time] in the lower right axis.
As needed, set the font size and color, and click [OK].