![]()
-
Please refer to the Settings Guide for details.
 19.13 Historical Trend Graph Settings Guide
 -
For details on how to draw parts and define the address, shape, color, and labels, please see the "Part Editing Procedure".
8.7.1 Editing Parts
![]()
Please refer to the Settings Guide for details.
![]() 19.13 Historical Trend Graph Settings Guide
19.13 Historical Trend Graph Settings Guide
For details on how to draw parts and define the address, shape, color, and labels, please see the "Part Editing Procedure".
![]() 8.7.1 Editing Parts
8.7.1 Editing Parts
Set the trend graph to zoom out (thin out data display) for normal use, and zoom in for detailed view. Also set a switch to zoom in and out.
From the [Parts (P)] menu, select [Historical Trend Graph (H)] or click ![]() . Place the Graph on the screen.
. Place the Graph on the screen.
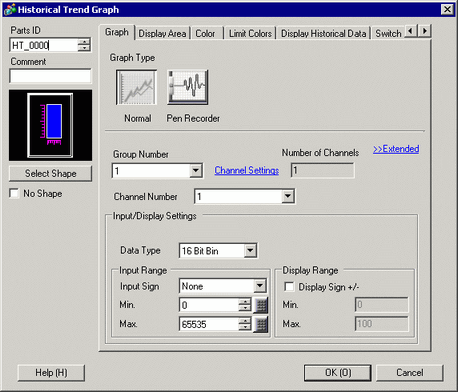
Double-click the new graph. The following dialog box appears.
Set the sampling group and address, then adjust settings such as line color, number of display data, and so on.
![]() 19.4.1 Procedure - Using Trend Graphs
19.4.1 Procedure - Using Trend Graphs
Click the [Display Area] tab, and click [Extended].
Select the [Thin Out Value] check box and set the level to thin out.

Select the magnification ratio usually applied for the graph from [Default Magnification].
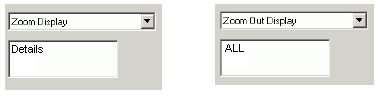
Click the [Switch] tab.
Set a switch for zooming the trend graph in/out. Select [Zoom In] and [Zoom Out].

In [Select Shape], select the Switch shape.
![]()
You can check the Display Magnification of the Historical Trend Graph using the system variable #H_HistoricalTrendMagnification. For more information about system variables, please see the following.
![]() A.2.2.2 Word Type - #H System Variables
A.2.2.2 Word Type - #H System Variables
In the [Switch Label] tab, select the Switch Label [Font Type] and [Display Language] as well as the [Text Color].
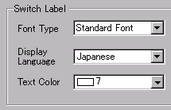
Use [Select Switch] to choose the switch and enter associated text in the [Label] field.
In [Switch Color], select the color of the switch.
![]()
When you use the [Switch Lamp] part's [Special Switch] function to add [Historical Trend Graph Switch] actions (instead of using switches in the Historical Trend Graph part), you can define the shape and color of individual switches.
Depending on the shape, you may not be able to change the color.
Click [OK].

![]()
When you select only a switch and press the [F2] key, you can directly edit the text on the label.