You can collect and display data in regular or random intervals in a trend graph.
You can use this to identify significant changes in data or to view the relationship between different data.
Up to 20 lines can be displayed on a single trend graph.
![]()
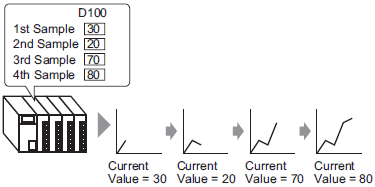
Use the Sampling function to get data. to display a historical trend graph, you first need to set up device/PLC data to be collected in the display unit using the sampling function.
![]() 25.3 Sampling Data at Constant Intervals
25.3 Sampling Data at Constant Intervals
![]() 25.4 Sampling Data at Specific Periods
25.4 Sampling Data at Specific Periods