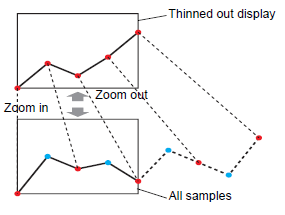
By spreading out the area for data sampled at regular intervals, you can display a trend graph with a longer time period (zoom out in the horizontal direction). Similarly, when you want to check data details, you can zoom into a graph.
Thin Out Display
When sampling data in short cycles, you may find it useful to view the graph at normal levels and check the changes in data. And zoom out to check out the graph display at a higher level, only when necessary.
Zoom Display
This feature is useful for checking data details in a graph.
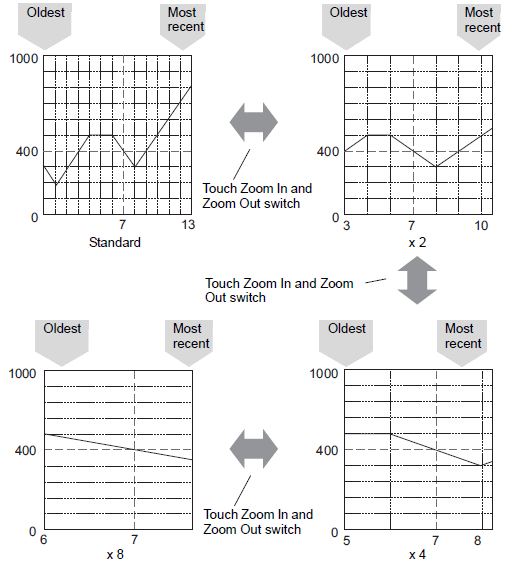
You can zoom in 2, 4, and then 8 times in the X-axis direction (horizontal), every time you touch the switch. You cannot zoom in at more than 8 times magnification. Zoom out zooms out the image to 1/2 of its current size in the X-axis direction (horizontal). Touching the [Zoom out] switch in the actual size display will produce a thin out display.
![]()
You can create individual [Zoom In]/[Zoom Out] switches with a Special Switch.
If the [Thin Out Value] is not specified in the [Display Area] tab of the Historical Trend Graph's parts settings dialog box, the actual size is the minimum display.
The oldest data always displays at the start of the graph, but the most recent data may not be at the end, depending on the magnification ratio.
Regardless of whether there is data older than the data displayed in the graph, the point touched becomes the center point for Zoom Display.
When there are only two points of data on the graph, you cannot zoom out.
When you want to Zoom In/Zoom Out in the Y-axis direction (vertical direction), from the [Display Direction] select [Display Range] and define the settings.
![]() 19.13.1.2 Historical Trend Graph - Graph/Extended
19.13.1.2 Historical Trend Graph - Graph/Extended