![]()
-
Please refer to the Settings Guide for details.
 20.12.1 Common Settings (Alarm) Settings Guide
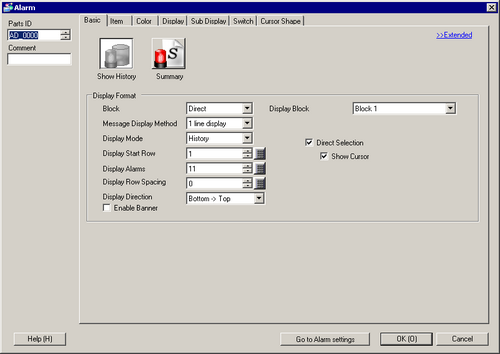
20.12.2 Alarm Parts Settings Guide
-
For information on how to draw parts, and define the address, shape, color, and labels, refer to the following.
8.7.1 Editing Parts