![]()
-
Please refer to the Settings Guide for details.
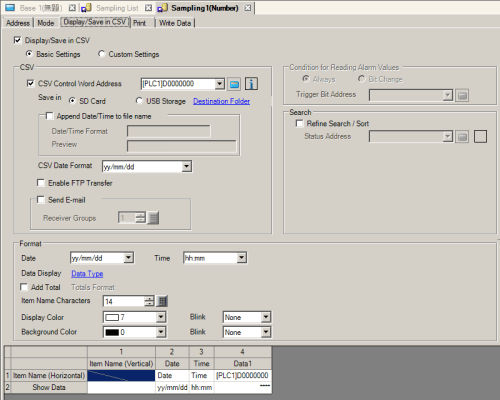
 25.11.4 Display/Save in CSV
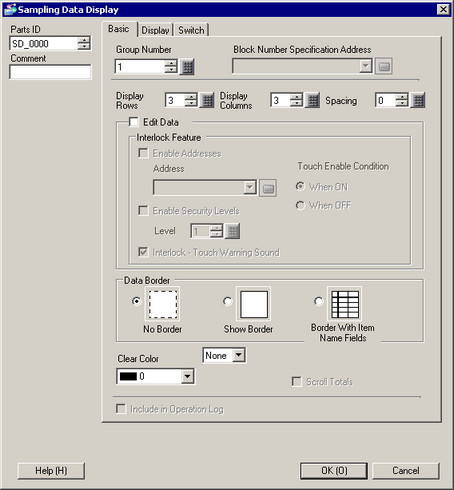
25.12 Sampling Data Display Guide
-
For details on how to draw parts and define the address, shape, color, and labels, please see the "Part Editing Procedure".
8.7.1 Editing Parts