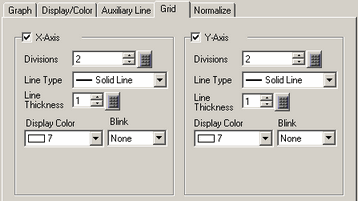
X-axis/Y-axis
Set whether or not to display a scale for x-axis and y-axis.
Divisions
Set the number of scale divisions to be displayed from 2 to 100.
Line Type
Select a type of the line from among the five patterns:
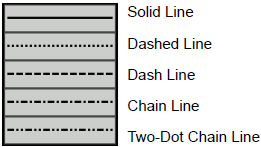
![]()
If the Graph screen is 16 pixels or less, any pattern other than a solid line may not properly display.
Line Thickness
Set the line thickness from 1 to 2.
Display Color
Set the line color.
Background Color
If you selected a line type other than the solid line, set the line's background color.
Blink
Select the blink and blink speed. You can choose different blink settings for the [Display Color], and [Background Color].
![]()
Depending on your display unit's model and [Color] settings, you may not be able to set Blink (from the [Project] menu, point to [System Settings] and click [Display Unit]).
![]() 1.6 Supported Colors
1.6 Supported Colors