![]()
-
When the value for the auxiliary line exceeds the graph display range, the auxiliary line will not display.
To use Auxiliary Lines, [Display Method] must be set to [Display Range].
![]()
When the value for the auxiliary line exceeds the graph display range, the auxiliary line will not display.
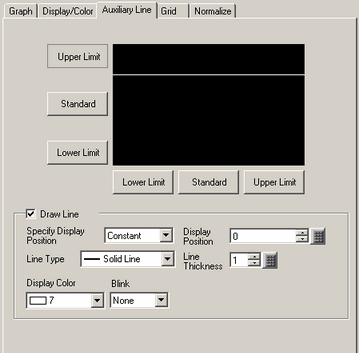
Upper Limit/Standard/Lower Limit
Select the auxiliary line to set.
Draw Line
Defines whether to draw the [Upper Limit], [Standard], and [Lower Limit] auxiliary lines in the selected positions.
Specify Display Position
Select the designation method of the auxiliary lines' display position from [Constant] or [Address].
Constant
Specify a set constant as the Display Position.
Address
Specify the address where the Display Position is stored.
Display Position
Set the auxiliary line's Display Position.
Each auxiliary line's setting range is as follows.
|
Data Type |
Display Sign +/- |
Setting Range |
|
16 Bit Bin |
Cleared |
0 to 65535 |
|
Selected |
-32768 to 32767 |
|
|
32 Bit Bin |
Cleared |
0 to 4294967295 |
|
Selected |
-2147483648 to 2147483647 |
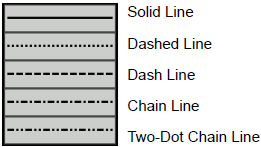
Line Type
Select the auxiliary line type:
![]()
If the Graph screen is 16 pixels or less, any pattern other than a solid line may not properly display.
Line Thickness
Set the auxiliary line thickness from 1 to 2.
Display Color
Set the auxiliary line color.
Background Color
If you selected a line type other than a solid line, set the auxiliary line's background color.
Blink
Select the blink and blink speed. You can choose different blink settings for the [Display Color], and [Background Color].
![]()
Depending on your display unit's model and [Color] settings, you may not be able to set Blink (from the [Project] menu, point to [System Settings] and click [Display Unit]).
![]() 1.6 Supported Colors
1.6 Supported Colors