To use Auxiliary Lines, [Display Method] must be set to [Display Range].
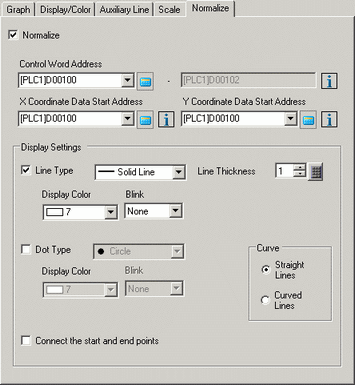
Normalize
Set to normalize data.
Control Word Address
Set up the address that controls showing and clearing the normalized display.
This can be set to either a PLC address or a display unit's internal device address.
Use a sequence of 3 words from the set address.
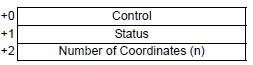
![]()
[Control], [Status] and [Number of Coordinates] are all fixed to 16 bit BIN format.
For 32 bit devices, use the bottom 16 bits. Enter [0] for the top 16 bits.
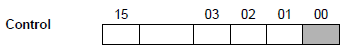
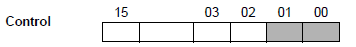
Control
Bit 0 and bit 1 of this address control when to show and clear the normalized display.
When bit 0 is ON (for example, "1" is stored in the address), normalized data will display.
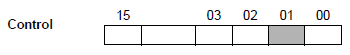
When bit 1 is ON (for example, "2" is stored in the address), the normalized display will clear.
When bit 0 and bit 1 are ON (for example, "3" is stored in the address), the normalized display will temporarily clear and then display again.
![]()
When the number of data is 0, the operation is as follows.
When control address bit 0 is ON and bit 1 is OFF
The normalized display remains the same.
When control address bit 0 and bit 1 are ON
The normalized display is cleared and no graph will display.
Status
Store the process status for drawing the normalized graph in this address.
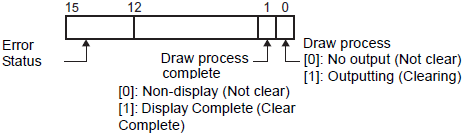
In a normalized display, status bit 0 turns ON while clearing the graph.
In a normalized display, on completion of clearing the graph, status bit 1 turns ON and bit 0 turns OFF.
Confirm status bit 1 is ON, and turn OFF bit 0 of the Control Address.
Turning OFF bit 0 in the Control Address will also turn OFF bit 1 in the status address.
The error status indicates the following error codes.
Error Code
|
Bit 12 to 15 |
Description |
Details |
|
0 |
Completed Successfully |
Transfer completed successfully. |
|
1 |
The number of coordinates is 0 |
When the Number of Coordinates is 0. |
|
2 |
Display Range Error |
Occurs when the following is true: 1) [Display Method] = [Display Range] and display ranges are defined using address values. 2) The difference between the upper and lower limits is 0, or the lower limit is greater than the upper limit. |
|
3 |
Communication error |
A communication (timeout) error occurs when getting coordinates. |
|
4 |
Reserved |
- |
|
: |
|
|
|
15 |
Reserved |
- |
Number of Coordinates
Set the data quantity to store for displaying in a graph. A maximum of 512 coordinates can be set.
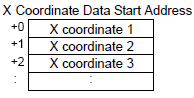
X Coordinate Data Start Address
Set the start address of the address area where X coordinate data is stored. The address area used depends on the device designated in [Start Address] and the [Data Type] settings.
Click the icon ![]() to display the structure of addresses in use.
to display the structure of addresses in use.
For example, when 16 bit device is specified in the address and 16 bit length is set in [Data Type]:
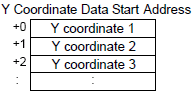
Y Coordinate Data Start Address
Set the start address of the address area where Y coordinate data is stored. The address area used depends on the device designated in [Start Address] and the [Data Type] settings.
Click the icon ![]() to display the structure of addresses in use.
to display the structure of addresses in use.
For example, when 16 bit device is specified in the address and 16 bit length is set in [Data Type]:
Display
Line Type
Set normalized data as a line.
When selected, select a type of line from among 5 patterns:
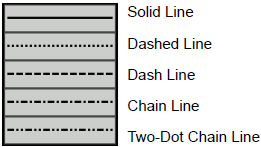
![]()
If the Graph screen is 16 pixels or less, any pattern other than a solid line may not properly display.
Line Thickness
Set the line thickness from 1 to 2.
Display Color
Set the line color.
Background Color
If you selected a line type other than the solid line, set the line's background color.
Pixel Size
Set normalized data as dots.
When selected, select a dot type from among the 7 patterns:![]() ,
,![]() ,
,![]() ,
,![]() ,
,![]() ,
,![]() ,
,![]() . The dot size is fixed at 5 pixels.
. The dot size is fixed at 5 pixels.
Display Color
Set the dot color.
Curve
Specify whether to curve the line within the display range when the data values exceeded the specified value of the display range.
When [Curved Lines] is selected, values that exceed the display range display as the preset upper limit. When both X and Y values exceed the display range, displays the intersecting point between upper limits.
When [Straight Lines] is selected, does not display values that exceed the display range.
![]()
When displaying a graph, if the 16-bit display range is exceeded, the graph will be curved regardless of the Curve setting.
Connect the start and end points
Specify whether to connect the start and end points of the normalized data to create a closed line.
Blink
Select the blink and blink speed. You can choose different blink settings for [Display Color], [Background Color], and [Graph Area Color].
![]()
Depending on your display unit's model and [Color] settings, you may not be able to set Blink (from the [Project] menu, point to [System Settings] and click [Display Unit]).
![]() 1.6 Supported Colors
1.6 Supported Colors