Configure scaling settings for each channel.
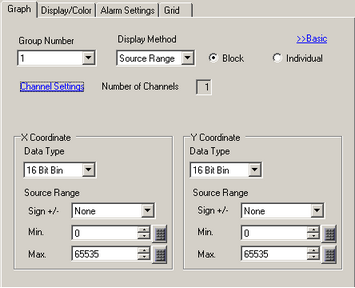
Display Method
Select the setup method for the graph display range from [Source Range] and [Display Range].
![]() 19.15.2.1 XY Historical Scatter Graph - Display Range
19.15.2.1 XY Historical Scatter Graph - Display Range
![]()
When [Display Range] is selected, the [Alarm] tab is hidden.
When [Source Range] is selected, the [Auxiliary Line] and [Normalize] tabs are hidden.
Block/Individual
When [Display Method] = [Source Range], select whether to handle channel settings (such as [Data Type] and [Sign +/-]) as a single block or individually.