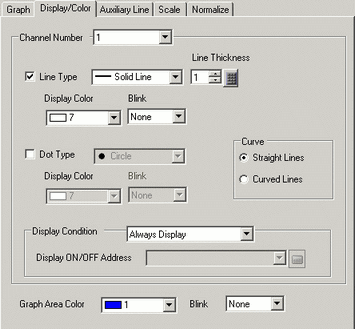
Channel Number
Select the Channel to configure the graph display and color.
Line Type
Specify whether to draw a line on the graph.
When checked, select a type of line from among 5 patterns:
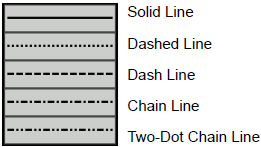
![]()
If the Graph screen is 16 pixels or less, any pattern other than a solid line may not properly display.
When comparing dot pattern with line pattern, the line pattern is drawn first.
Line Thickness
Set the line thickness from 1 to 2.
Display Color
Set the line color.
Background Color
If you selected a line type other than the solid line, set the line's background color.
Pixel Size
Specify whether to show the points on the graph. When selected, select a dot type from among the 7 patterns:![]() ,
,![]() ,
,![]() ,
,![]() ,
,![]() ,
,![]() ,
,![]() The dot size is fixed at 5 pixels.
The dot size is fixed at 5 pixels.
Display Color
Set the dot color.
Curve
Specify whether to curve the line within the display range when the data values exceeded the specified value of the display range.
When [Curved Lines] is selected, the value over the display range is displayed as a preset upper level. When both X and Y values exceed the display range, the value where the X and Y upper limits cross will be displayed.
When [Straight Lines] is selected, the value over the display range is not displayed.
![]()
When displaying a graph, if the 16-bit display range is exceeded, the graph will be curved regardless of the Curve setting.
Display Condition
Select the graph display condition.
Always Display
Always displays the graph.
Display When Bit OFF
Displays the graph when [Display ON/OFF Address] is OFF an hides the graph when [Display ON/OFF Address] is ON.
Display When Bit ON
Displays the graph when [Display ON/OFF Address] is ON an hides the graph when [Display ON/OFF Address] is OFF.
Display ON/OFF Address
Set the bit address to turn ON/OFF the graph display.
Graph Area Color
Select a color for the Graph Display Area.
Blink
Select the blink and blink speed. You can choose different blink settings for [Display Color], [Background Color], and [Graph Area Color].
![]()
Depending on your display unit's model and [Color] settings, you may not be able to set Blink (from the [Project] menu, point to [System Settings] and click [Display Unit]).
![]() 1.6 Supported Colors
1.6 Supported Colors