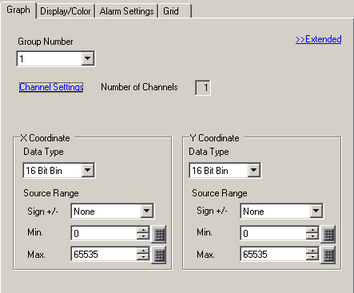
Group Number
The sampling group number from 1 to 64 of the graph to display.
Channel Settings
Open the [Channel Data Settings] dialog box appears. From among the specified sampling group, set the address and number of addresses (Number of Channels) of the line you want to display as an xy graph.
The Number of Channels can be from 1 to 10.
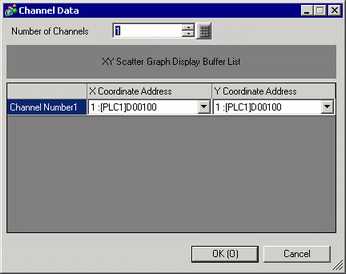
Number of Channels
The set Number of Channels appears in the [Channel Data Settings] dialog box. The number of channels displays as lines on the Graph Display Area.
Channel Number
Select the Channel to configure.
X Coordinate/Y Coordinate
Set [Data Type] and [Acquisition Range] for X and Y coordinates.
Data Type
Select the graph display data type from [16 Bit Bin], [16 Bit BCD], [32 Bit Bin], [32 Bit BCD], or [32 Bit Float].
Acquisition Sign
Set whether graph display data can handle negative numeric data. This can only be set when the [Data Type] is [16 Bit Bin] or [32 Bit Bin].
None
Only positive numeric data will be handled.
2's Complement
Negative numbers are handled with 2's complement.
MSB Sign
Negative numbers are handled with MSB sign.
Min. Value/Max. Value
Select the source data range for data displayed on the XY graph.
The setup range differs depending on the [Data Type] and [Sign +/-].
|
Data Type |
Sign +/- |
Range |
|
16 Bit Bin |
None |
0 to 65535 |
|
2's Complement |
-32768 to 32767 |
|
|
MSB Sign |
-32767 to 32767 |
|
|
32 Bit Bin |
None |
0 to 4294967295 |
|
2's Complement |
-2147483648 to 2147483647 |
|
|
MSB Sign |
-2147483647 to 2147483647 |
|
|
16 Bit BCD |
0 to 9999 |
|
|
32 Bit BCD |
0 to 99999999 |
|
|
32 Bit Float |
-9.9e16 to 9.9e16 |
![]()
The corresponding source data collected from the sampling function is converted as a ratio of 1000 for display in the graph.