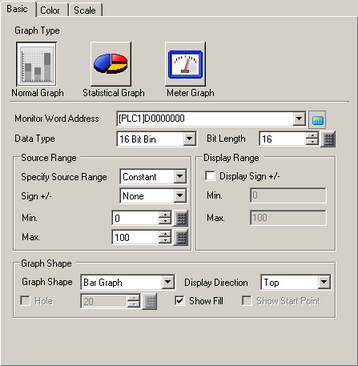
Monitor Word Address
The data stored in this Word Address displays in the graph.
Data Type
Select the graph display data type from [16 Bit Bin], [16 Bit BCD], [32 Bit Bin], [32 Bit BCD], or [32 Bit Float].
Bit Length
If [Data Type] is [16 Bit Bin], set the data's enabled bit length from 1 to 16.
Source Range
Specify Source Range
Select the method for specifying the maximum and minimum values for the source data.
Constant
Specify a set constant as the Min/Max.
Address
Specify the address where the Min/Max values are stored.
Sign +/-
Set whether graph display data can handle negative numeric data. This can only be set when the [Data Type] is [16 Bit Bin] or [32 Bit Bin].
None
Only positive numeric data will be handled.
2's Complement
Negative numbers are handled with 2's complement.
MSB Sign
Negative numbers are handled with MSB sign.
Min. Value/Max. Value
Set the source data for graph display data.
If [Specify Source Range] is [Constant], enter the maximum / minimum values.
If [Specify Source Range] is [Address], specify the word address where the min/max value is stored.
The setup range is different depending on the [Data Type] and [Specify Source Range] values.
|
Data Type |
Sign +/- |
Range |
|
16 Bit Bin |
None |
0 to 65535 |
|
2's Complement |
-32768 to 32767 |
|
|
MSB Sign |
-32767 to 32767 |
|
|
32 Bit Bin |
None |
0 to 4294967295 |
|
2's Complement |
-2147483648 to 2147483647 |
|
|
MSB Sign |
-2147483647 to 2147483647 |
|
|
16 Bit BCD |
- |
0 to 9999 |
|
32 Bit BCD |
- |
0 to 99999999 |
|
32 Bit Float |
- |
-9.9e16 to 9.9e16 |
![]()
The corresponding [Specify Source Range] in the word address is converted as a ratio of 1000 for display in the graph.
Display Range
Display Sign +/-
Set to display negative numbers. This can be set when the [Data Type] is [Bin] or [Float].
For example, for a Bar Graph
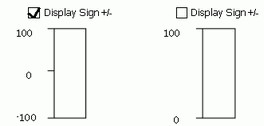
Min./Max.
Shows the display range's Min and Max. If [Display Sign +/-] is set, the Min is "-100". If it is not set, the Min is "0". The Max is fixed as "100".
Graph Shape
Graph Shape
Choose the graph shape from [Bar Graph], [Circle Graph], [Semicircle Graph], and [Tank Graph].
Display Direction
Set a direction for the graph display. If the [Graph Shape] is [Bar Graph] or [Tank Graph], choose from [Top], [Bottom], [Left], or [Right]. For [Circle Graph] and [Semicircle Graph], the starting point is fixed at the top and rotates clockwise.
Hole
When the [Graph Shape] is [Circle Graph] or [Semicircle Graph], set the radius of the inner circle.
![]()
If you set the radius of the inner circle to less than 20 dots, the graph may not be properly displayed.
Show Fill
Set whether to display a fill in the graph. If you do not want to display a fill, the graph is set to a Meter Graph.
Show Start Point
If the [Graph Shape] is [Circle Graph] or [Semicircle Graph] and [Show Fill] is not set, select whether to display the start point.