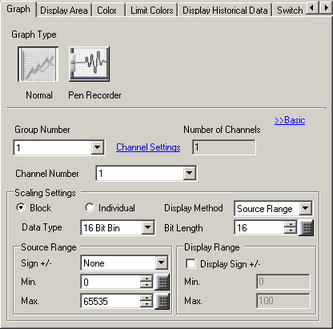
Configure scaling settings for each channel.
Block/Individual
Select Block to define the scaling settings, such as [Data Type] and [Sign +/-] as a single group. Select Individual to define settings individually for each channel.
Display Method
Select the setting method for the graph display range from [Source Range] and [Display Range].
![]()
When [Display Range] is selected, you cannot select the [Fill Below Line] check box in the [Color] tab's Extended settings.
When [Display Range] is selected, the [Alarm] tab is hidden.
When [Source Range] is selected, the [Auxiliary Line] tab is hidden.
Data Type
Select the format of data to display on the graph.
When [Display Method] is [Source Range], select [16 Bit Bin], [16 Bit BCD], [32 Bit Bin], [32 Bit BCD], or [32 Bit Float].
When [Display Method] is [Display Range], select [16 Bit Bin], [32 Bit Bin], or [32 Bit Float].
![]()
When using the following models, you cannot use [32 Bit Float] with the [Display Range] setting.
GP-4100 Series (Monochrome Model)
GP3000 Series
LT3000 Series
ST3000 Series
Bit Length
You can define the bit length, from 1 to 16, when the [Display Method] is [Source Range] and the [Data Type] is [16 Bit Bin].
![]()
When [Bit Length] = 1 and the bit value becomes "1", the graph will display the value "1" when [Sign +/-] = [None]. When [Sign +/-] =[2's Complement] or [MSB Sign], graph display value will always be "0".
Constant/Address
When [Display Method] is set to [Show Scale], select whether to define the upper and lower limits with numerical values or address values. Data exceeding the display range will not display on the graph.
Constant
The setting range differs, depending on the [Data Type] and [Display Sign +/-] settings.
|
Data Type |
Display Sign +/- |
Range |
|
16 Bit Bin |
Check box cleared |
0...65535 |
|
16 Bit Bin |
Check box selected |
-32768...32767 |
|
32 Bit Bin |
Check box cleared |
0...4294967295 |
|
32 Bit Bin |
Check box selected |
-2147483648...2147483647 |
|
32 Bit Float |
- |
-9.9e16 to 9.9e16 |
Address
Set the Word Address.
The graph display is updated when the value of address is changed.