You can set up when using Extended graph settings.
Displays only the specified range of the graph. When data is concentrated in a fixed range, this is useful for verifying details.
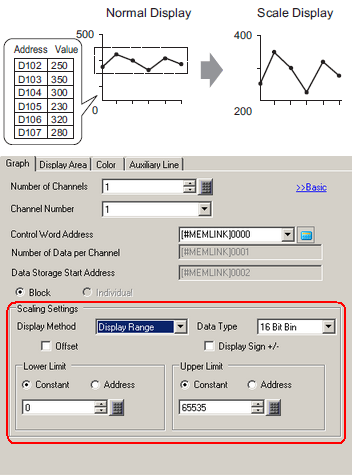
Scaling Settings
Display Method
Select the setting method for the graph display range from [Source Range] and [Display Range].
![]()
When [Display Range] is selected, you cannot select the [Fill Below Line] check box in the [Color] tab's Extended settings.
When [Display Range] is selected, the [Alarm] tab is hidden.
When [Source Range] is selected, the [Auxiliary Line] tab is hidden.
Data Type
Choose the graph data type from [16 Bit Bin] or [32 Bit Bin].
Offset
Select whether to display an offset on the graph.
![]() 19.10.3 Data Block Display Graph Structure
19.10.3 Data Block Display Graph Structure
Display Sign +/-
Set to display negative numbers.
Upper Limit/ Lower Limit
Select the method for setting the upper limit and lower limit of the display range from [Constant] or [Address], and then set the limits.
Constant
Specify a set constant as the minimum and maximum value.
Address
Specify the address where the Upper/Lower Limit values are stored.
|
Data Type |
Display Sign +/- |
Setting Range |
|
16 Bit Bin |
Cleared |
0 to 65535 |
|
Selected |
-32768 to 32767 |
|
|
32 Bit Bin |
Cleared |
0 to 4294967295 |
|
Selected |
-2147483648 to 2147483647 |
![]()
If [Display Sign +/-] is selected, negative numbers are handled using 2's complement.
When set to [Address], the graph updates when there is a change in address values.
![]()
Data outside the display range will not be displayed.
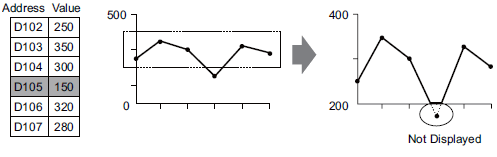
The Display Range updates when you clear the display or change screens.