For Historical Trend Graphs, Data Block Display Graphs, XY Historical Scatter Graphs and XY Block Display Scatter Graphs, you can display up to 8 graphs on a single screen (including called screens and popup windows) at the same time.
For Historical Trend Graphs, Data Block Display Graphs, XY Historical Scatter Graphs, and XY Block Display Scatter Graphs, you can display up to 40 channels on a single screen simultaneously (including called screens and popup windows). Any subsequent channels do not display.
The maximum number of channels (number of lines) that can be displayed on a single Historical Trend Graph is 20.
In the normal display, the graph display area is updated when a graph scrolls over or is erased (sampling data is cleared). In the pen recorder display, every time data is sampled, the display is updated. When the display is updated, the graph display area is filled in with a clear color and then the graph is displayed again. Therefore the screen may flicker.
Coordinate points of the graph data are calculated as a value between 1 and 1000. Even though values may be outside the display range, if the converted values are within range, they will display in the graph.
Do not draw other parts in the graph display area. To draw pictures such as lines directly within the display area, place the graph on base screen 9000 to 9999. If you draw scale lines within the graph display area on base screens 1 to 8999, the scale lines will not show on the display unit. To display a graph with scale lines on base screens 1 to 8999, load screen 9000 or higher.
On screen 9000 or higher, draw the graph and objects that overlay the graph. Other parts such as switches may not operate properly.
When using the graph area color with a graph with no shape on base screen 9000 or higher, drawing is done in the following order. As a result, if you draw on the graph display area, or you set the base screen's background color, these draw with a higher priority than the Graph Area Color.
-
Graph Area Color
-
Drawings such as Line or Rectangle, or Base screen background color
-
Line Chart
When the sampling period is specified as 1 second or less, depending on the size of the graph display area used, scroll processing can take almost one second, and communication and tag processing can be affected.
In this case, setting the sampling period to two or more seconds should correct the problem.
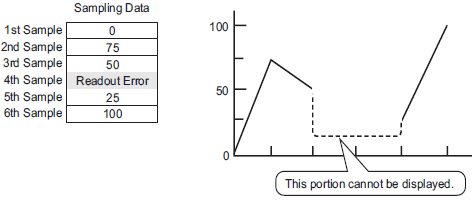
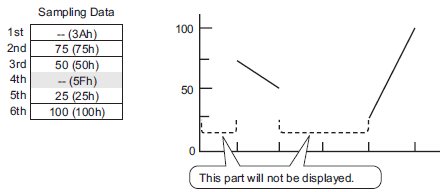
If an error occurs when reading data samples, the line on that portion of the graph will not display. If the error continues, the graph display will not display for that period. Similarly, when you use the thin out display (zoom), thinned out data with read errors will not display.
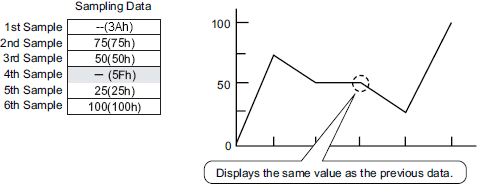
When the next sampled data displays on the historical trend graph, it displays as follows.