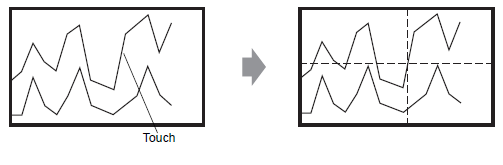
Touch the "Display Historical Data" switch to change to the Display Historical Data Mode.
![]()
-
If Display Historical Data Mode is not selected, the cursor will not appear when you touch the Graph Display Area.
-
When a Special Switch (with [Special Action] set to [Historical Trend Graph Swich] and [Action] set to [Display Historical Data Switch]) overlaps a Historical Trend graph, you cannot move the cursor, even if you select the historical data display mode and touch the graph display area.
-
If there is no data in the display unit's backup memory (SRAM), search for a file with the same sampling settings as the backup data file (Bin format) in external storage. If there are files, you can display the cursor. There are multiple files (Bin format) of backup data. Only the graph for 1 file will display.
-
Graph data for the point touched (date, time and graph value) is stored in the [Cursor Information Storage Address] for the number of channels set. Stored data can be displayed on [Date Display].
 14.2 Displaying/Inputting Numeric Data
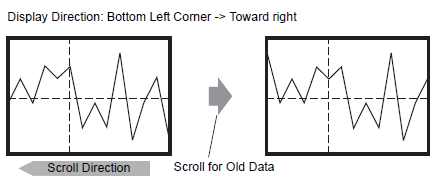
Touch the [Scroll for Old Data] switch to scroll the graph.
When scrolling, the graph moves while the cursor position remains fixed.
![]()
-
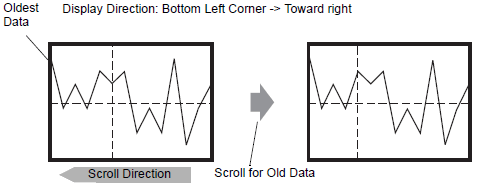
When the oldest data (on the left axis here) displays while scrolling, the graph becomes fixed while the cursor moves.
-
If you keep scrolling after the cursor has moved to the end, the cursor is shown only in the X-axis direction (horizontal).
-
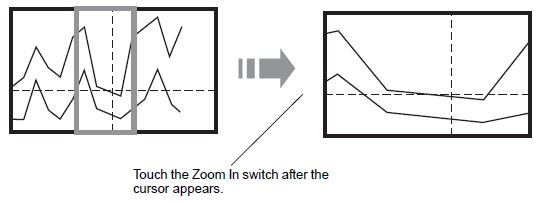
When you touch the zoom display switch after the cursor is shown, the Y axis of the cursor defines the center point and zoom in to spread the data points horizontally.