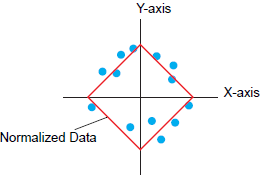
Displays two sampled values in x/y-axis coordinates of the graph using dots or lines. This feature is useful to view data distribution or the correlation between two items.
You can display normalized data and compare it with actual data.
![]()
Use the Sampling function to get data. to display a historical trend graph, you first need to set up on the display unit the device/PLC data to collect using the sampling function.
![]() 25.3 Sampling Data at Constant Intervals
25.3 Sampling Data at Constant Intervals
![]() 25.4 Sampling Data at Specific Periods
25.4 Sampling Data at Specific Periods
![]()
Please refer to the following for models compatible with XY Historical Scatter Graphs.
![]() 1.5 Supported Features
1.5 Supported Features
In a XY Historical Scatter Graph, you can display data up to the number of [Occurrences] set up in the sampling group.
![]() 19.9.1 Procedure - Displaying Sampled Data in a Scatter Graph
19.9.1 Procedure - Displaying Sampled Data in a Scatter Graph