![]()
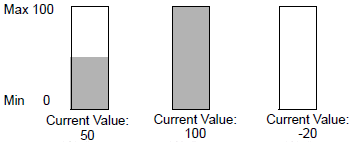
When a value outside of the set input range is collected, the Graph Display only shows values up to the maximum and down to the minimum.
For example, when the input range Min = 0, Max = 100
When corrupt BCD data is collected, the graph cannot be displayed properly.
When valid BCD data is collected, the graph is updated to a normal display.
If the data is invalid from the start and no previous correct values exist, the graph will not display until valid values are collected.