Touch the "Display Historical Data" switch to change to the Display Historical Data Mode.
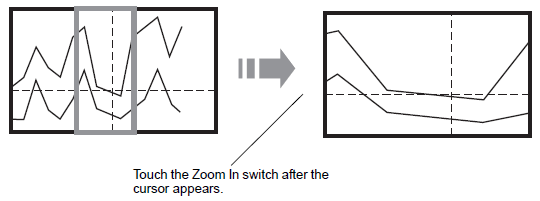
Touch the [Zoom In]/[Zoom Out] switch.
![]()
The [Zoom In]/[Zoom Out] switch can be placed individually by creating a Special Switch.
Zoom In and Zoom Out cannot be used if [Show Cursor] is not ON.
![]() 18.13.1.9 Historical Trend Graph - Display Historical Data
18.13.1.9 Historical Trend Graph - Display Historical Data
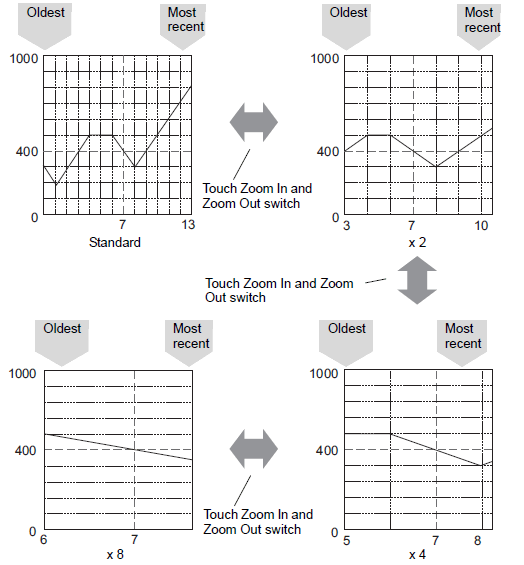
Zoom Display zooms in 2, 4, or 8 times in the X-axis direction (landscape) every time you touch the switch. It cannot be zoomed in more than 8 times. Zoom Out Display zooms out the image to 1/2 its current size in the X-axis direction (landscape).
![]()
Once displayed in Original Size, the graph cannot be zoomed out any further.
The oldest data is always displayed at the start of the graph, but the most recent data may not be at the end, depending on the magnification ratio.
Time Display is available when zoomed in or out; depending on the magnification, the graph's endpoint may not appear on the sampling display. In this case, the date and time of the newest sampled data displays.
Regardless of whether there is data older than the data displayed in the graph, the point touched becomes the center point for Zoom Display.
When there are only two sets of data displayed in the graph, further data cannot be displayed.
When you want to Zoom In/Zoom Out in the Y-axis direction (portrait), enable the [Show Scale] setting in [Display Direction].![]() 18.13.1.2 Historical Trend Graph - Graph/Extended
18.13.1.2 Historical Trend Graph - Graph/Extended