GP-Pro EX's basic screen part names and functions are as follows:

Title Bar
Displays a project file name or screen title.
Menu Bar
Displays GP-Pro EX operation menus. Available menus change depending on what you are editing.
Project
Operate and configure the entire project by creating new projects, saving projects, etc.
![]() 3.8.1 Creating a New Project
3.8.1 Creating a New Project
![]() 3.8.2 Properties Settings Guide
3.8.2 Properties Settings Guide
![]() 3.8.4 Utility Settings
3.8.4 Utility Settings
Edit
This is the edit tool for the editing area.
![]() 8.2.1 Introducing Edit Tools
8.2.1 Introducing Edit Tools
Display
Sets the display method comprehensively for GP-Pro EX.
![]() 3.8.5 Preferences Settings Guide
3.8.5 Preferences Settings Guide
Common Settings
Lists the common settings.
![]() 5.5 Common Settings
5.5 Common Settings
Draw
Lists the drawing tools.
Parts
Lists the parts tools.
Screen
Creates new screens or checks screen information.
![]() 3.8.6 Screen Settings Guide
3.8.6 Screen Settings Guide
Screen Capture
Copies or outputs a file of the screen image displayed in a preview display or simulation to the clipboard.
In the preview screen, from the [Screen Capture] menu, selecting [Show Window] or [Hide Window] shows or hides multiple windows at once.
Help
For checking the GP-Pro EX version, checking for updates, and opening the manual.
Operation State Bar
Select the operation status from [Edit], [Preview], [Simulation], [Screen Transfer Project], or [Monitor] to switch to each screen.
You can switch the state bar between show and hide from the [Toolbar]-[State Bar] from the [View] menu. Moreover, the bar can be moved to a preferred position, namely left, right, top, or bottom of the screen, by dragging it.
Edit
Displays the screen editor in the workspace. You can draw graphics and define common settings.
Preview
Displays the preview screen. Here you can confirm the display state of screens. You can copy previews to the clipboard or save them as JPEG files.
Simulation
Starts Simulation. You can check actions without connecting to the connecting device (such as PLC) before you transfer the project file.
Transfer Project
Transfer Tool launches.
![]() 34.12.1 Transfer Settings Guide
34.12.1 Transfer Settings Guide
Monitor
When the display unit is connected to the PC, you can view the operation and state of the logic program on the display unit from the PC.
![]() 30.12 Monitoring Logic Programs on the Computer (Online Monitoring)
30.12 Monitoring Logic Programs on the Computer (Online Monitoring)
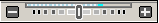
Toolbar
Displays command icons, such as Part, Draw or Edit. Click one of these icons with the mouse to execute the operation.
You can show or hide the toolbar. From the [View (V)] menu, select [Toolbar (T)]. Also, the bar can be moved by dragging and placing it on the left, right, top, or bottom of the screen. Listed are the following sections on the Toolbar.
![]()
You can customize the toolbar depending on frequency of use.
On the [View (V)] menu, point to [Preferences (O)], select [Toolbar], and click [Toolbar Settings]. The Toolbar Settings window appears. It allows you to add and delete icons. Alternatively, right-click the icon on the toolbar to display the Toolbar Settings window.
Standard

Edit

Display

Draw

Parts

Instructions

Package

Common Settings
![]()
Editing Area Tiling

Change part state

Work Space
The associated window appears.
You can change the location of the window by dragging and dropping the window onto one of the directional icons below.
Arrows on the icon's top, bottom, left and right 
Arrows that appear at the top, bottom, left and right sides of the editing area![]()
![]()
You can overlap or set up a tabbed display for windows., can be placed overlapping and displayed by switching using tabs.
Click the icon ![]() to minimize the window display.
to minimize the window display.
Project Window/Address Settings Window/Screen List Window/Search Window
Displays [Project Window], [Address Settings Window], [Screen List Window], [Search Window].
Project Window
Address Settings
Screen List
Search
Properties
Displays the selected part or screen's attributes to confirm or edit the attributes.
![]() 3.8.3.4 Properties
3.8.3.4 Properties
![]()
This window is displayed the first time you start up the display unit.
This window lists the shapes of the parts. This allows you to select, drag and drop, and place the shapes of parts you wish to use onto the screen.
![]() 3.8.3.8 Parts Toolbox
3.8.3.8 Parts Toolbox
Package
Lists the package graphics registered under [Package List].
![]() 3.8.3.9 Package
3.8.3.9 Package
Color
Displays the color palettes available for the selected models in the display. When you drag and drop the selected color onto the color attributes of the parts, it enables you to change the color.
Screen Data List Window
Displays a list of drawings and Parts on the screen.
![]() 3.8.3.5 Screen Data List Window
3.8.3.5 Screen Data List Window
Comment List
Watch List
Error Check
Displays a list of errors found on the created screen. You can do an error check by clicking the icon in the window.
![]() 3.8.4.4 Utility - Error Check
3.8.4.4 Utility - Error Check
PID Monitor
Returns the display position to the initial value.
When the display window on the work space is moved, this returns the display window to its initial location.
Editing Area
Edit the screen. Configures [System Settings] and [Common Settings].
You can change the display format of the screen editor from the [View (V)] menu's [Editing Area (B)] option. When the screen is displayed, the display state can be switched using [Zoom (Z)] or [Change Language (L)] from the [View (V)] menu.
Status Bar
Starting from the left, the status bar information indicates the following.
Information on selected parts
Display Navigator
Part at the frontmost part of the screen in the Display Navigator
Mouse coordinates in the editing area
Display unit model name
Information on selected parts
From the left, displays information of selected parts in the following order.
Part Name, Parts ID, (left X-coordinate, top Y-coordinate)-(right X-coordinate, bottom Y-coordinate), [Part width x height]
Display Navigator
Shows and hides parts on the screen editor.
On the Display Navigator, click ![]() to hide parts on the screen in order from the frontmost part (last part drawn on the screen).
to hide parts on the screen in order from the frontmost part (last part drawn on the screen).
Click the icon ![]() to show the parts again in reverse order of the hidden parts.
to show the parts again in reverse order of the hidden parts.
Parts that are hidden by the [Display Navigator] are grayed out in the [Screen Data List] window. Select the gray parts in the list to display it.
![]()
In the Display Navigator, you can drag the icon ![]() left and right to show and hide parts.
left and right to show and hide parts.
Part at the frontmost part of the screen in the Display Navigator
Displays the name of the part at the frontmost part of the screen in the Display Navigator.
Mouse coordinates in the editing area
Displays the position (X / Y coordinates) of the mouse on the screen editor. The top-left of the screen is (0, 0).
Display unit model name
Shows the model name of the display unit set up in the project.
The window displays the enlarged image around the cursor.
From the [View (V)] menu, select [Zoom Box] to display/hide the screen or to change the enlargement percentage.
![]()
Right-click the Zoom Box window to popup a menu. Using these menu commands, you can hide the window and change the Zoom Box's zoom level.
Function Bar
Lists the operations allocated to the function keys. Click the function bar to directly trigger the mapped operation.
You can switch the Function Bar between show and hide from the [Toolbar]-[State Bar] from the [View] menu. Moreover, the bar can be moved to a preferred position, namely left, right, top, or bottom of the screen, by dragging it.
![]() 3.8.5.3 Preferences - Function Bar
3.8.5.3 Preferences - Function Bar
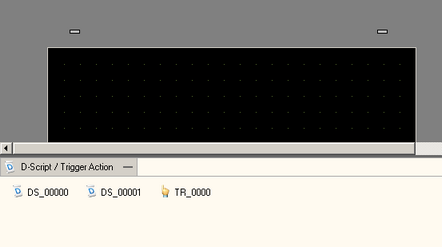
Component tray
This option is displayed when D Script and Trigger Action are disposed. When you click the title bar, you can switch between show/hide. The display position of parts displayed in the component tray can be changed by dragging & dropping.
 3.1 Naming Areas in the GP-Pro EX Main Window