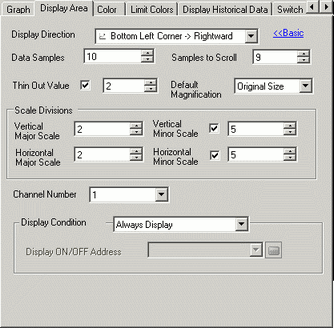
Set whether or not to use the Thin Out feature. When checked, set [Thin Out Value].
Thin Out Value
Set this value within the range of 2 to 100. Sampled data are displayed after being thinned out based on the Thin Out Value.
For example, when the [Thin Out Value] is "3" and the sampling [Occurrences] is "10", data from 1, 4, 7, and 10 will display in the graph.
![]()
Based on the first sampled data, data will be spread out. When the old data is overwritten, the data to be spread out is calculated from the total sampling number.
Default Magnification
Set the display magnification when the screen is changed.
Thin Out Mode
This can be selected only when [Thin Out Value] is set.
Original Size
x 2
x 4
x 8